

I help EcoSure | Ecolab create a unified digital experience across products, scale design through AI and governance, and turn operational data into action for customers.
XO Design System
Creating One Experience Across a Product Portfolio

My perspective
I did not want to build another library that looked complete in Figma but had little influence on the products themselves.
The opportunity was to create a shared language that reduced repeated decisions while giving each product room to solve its own needs.
What I led
- Defined shared foundations, components, content, accessibility, and iconography
- Connected design standards with documentation and governance
- Established a model for product-specific extensions
- Positioned adoption as a shared design and engineering responsibility
Evidence today
XO provides a common foundation across five product lines: TrueView, HDI, Lobster Ink, QPower, and CAP. Its stated purpose is to reduce decision friction and improve quality and consistency.
Success Metrics
- Percentage of eligible screens using XO components
- Number of products adopting shared foundations
- Component reuse rate
- Duplicate component reduction
- Average design-to-development lead time
- Accessibility issue rate
- Number and age of unresolved system requests
I established a shared experience foundation across five product lines, with adoption, reuse, delivery speed, and accessibility defined as the measures of long-term success.
QPower Coaching experience
Turning Portfolio Data Into Clear Management Action
My perspective
These managers may return after weeks away. I could not assume that they would remember the interface, its terminology, or the correct next step.
I designed the experience to restore context before asking users to act.
What I led
- Reframed the dashboard around management responsibilities
- Created the Start, Coach, and Support model
- Connected portfolio performance with property-level action planning
- Defined prioritisation, filtering, recognition, and status progression
- Aligned the wider journey before finalising individual components
Evidence today
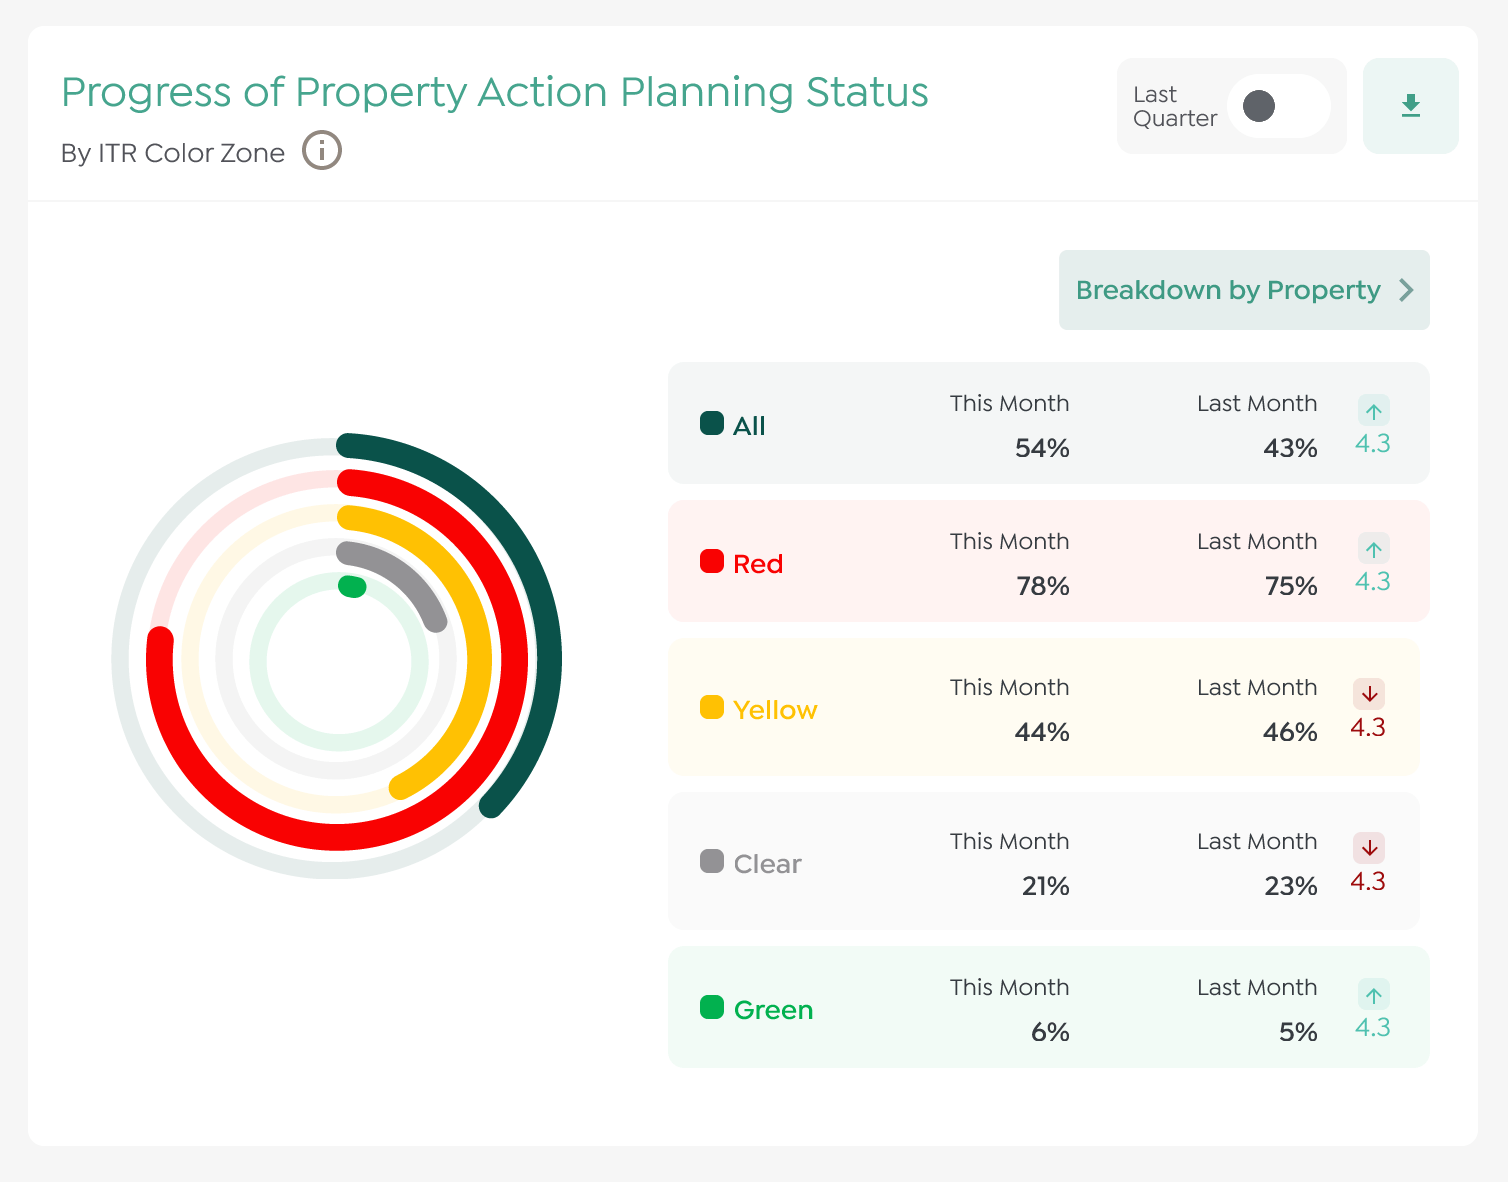
The experience gives managers visibility over four properties and their twelve associated action plans per page. It dynamically moves properties through Start, Coach, and Support based on action-plan state.
The revised 4.1 proposal was estimated at approximately 3,254 hours before two omitted filters were added, compared with the 3,387-hour cost-managed version 4 estimate. This is delivery-planning evidence, not a user outcome.
Success Metrics
- Time to identify the property requiring attention
- Percentage selecting the correct coaching path
- Action-plan launch rate
- Start-to-Coach conversion rate
- Stalled-plan recovery rate
- Overdue-solution rate
- Recognition actions sent
- Repeat usage by multi-property managers
I turned a reporting-heavy dashboard into three actionable management paths, designed to help infrequent users identify priorities and move properties from stalled work toward active coaching.
PublishAI
Designing AI Around Confidence, Not Just Speed
My perspective
AI makes the moment of creation feel effortless. The more consequential design work starts immediately afterwards.
I wanted authors to understand what happened, remain in control, recover safely, and know when the result was genuinely ready.
What I led
- Structured the journey from source to published learning
- Separated acquisition, generation, editing, and readiness
- Defined visible progress and recovery
- Preserved intentional human review
- Introduced accessibility, translation, and assessment checks
Evidence today
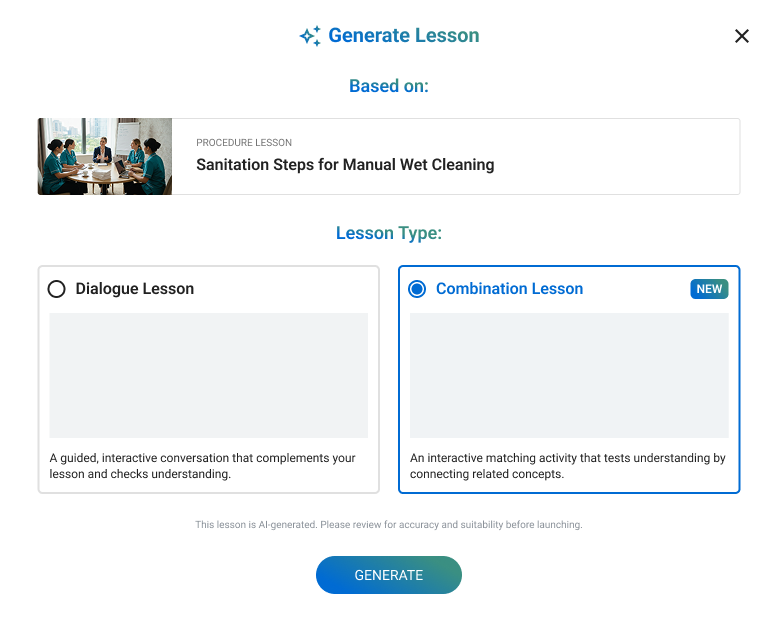
The design direction explicitly separates AI generation, human editorial control, and publication readiness. It recommends validating the funnel before applying final visual styling.
Current adoption evidence includes at least six courses at one customer recording more than 1,000 completions each, although the team noted that the consistency of those figures should be checked.
Success Metrics
- Time from source upload to first editable draft
- Generation completion rate
- Generation abandonment rate
- Percentage of AI changes reviewed before application
- Undo and recovery success rate
- Publication-readiness pass rate
- Average manual edits before publication
- Author confidence after publishing
- Learner completion and feedback scores
I reframed AI authoring around confidence and editorial control, with generation speed, recovery, review completeness, and publication readiness as the core measures.
UX Agents
Scaling Design Capacity Without Outsourcing Judgement
I created a bounded agent model designed to improve research, copy, and estimation. The business case anticipates 16–25 hours of weekly assisted capacity, with realised time savings and output quality still requiring validation.
The Screenless Design System
Extending Design Governance Beyond the Interface
I extended the design-system model from interface consistency to behavioural accountability, defining explanation, approval, recovery, traceability, and human control as measurable experience qualities.
TrueView Product Strategy
Making Inspection-to-Resolution the Product Advantage
I shifted the strategic focus from inspection features to resolution confidence, creating a measurement model around clarity, closure speed, exception recovery, and repeat-risk reduction.
TrueView Premium Concept
Turning Analytics Into a Credible Commercial Story
I translated a broad commercial request into three connected decision views, while making feasibility explicit so the concept could inspire without overpromising.
LobsterInk UX Study
Moving From Assigned Learning to Applied Skill
I moved the design conversation from content access to learner momentum, defining the measures needed to connect assignment, completion, practical application, and manager action.
CAP Evidence and TrueView Media Library
Turning an Uploader Into an Evidence Lifecycle
I expanded a component request into a complete evidence lifecycle, with successful upload, retrieval, reuse, traceability, and reporting defined as the real measures of success.
Cross-Product Tone of Voice
Giving Different Products One Clearer Voice
I established a shared content direction across three products, turning language consistency, comprehension, recovery, and terminology reuse into measurable design-system concerns.

I help EcoSure | Ecolab create a unified digital experience across products, scale design through AI and governance, and turn operational data into action for customers.
XO Design System
Creating One Experience Across a Product Portfolio
My perspective
I did not want to build another library that looked complete in Figma but had little influence on the products themselves.
The opportunity was to create a shared language that reduced repeated decisions while giving each product room to solve its own needs.
What I led
- Defined shared foundations, components, content, accessibility, and iconography
- Connected design standards with documentation and governance
- Established a model for product-specific extensions
- Positioned adoption as a shared design and engineering responsibility
Evidence today
XO provides a common foundation across five product lines: TrueView, HDI, Lobster Ink, QPower, and CAP. Its stated purpose is to reduce decision friction and improve quality and consistency.
Success Metrics
- Percentage of eligible screens using XO components
- Number of products adopting shared foundations
- Component reuse rate
- Duplicate component reduction
- Average design-to-development lead time
- Accessibility issue rate
- Number and age of unresolved system requests
I established a shared experience foundation across five product lines, with adoption, reuse, delivery speed, and accessibility defined as the measures of long-term success.
QPower Coaching experience
Turning Portfolio Data Into Clear Management Action
My perspective
These managers may return after weeks away. I could not assume that they would remember the interface, its terminology, or the correct next step.
I designed the experience to restore context before asking users to act.
What I led
- Reframed the dashboard around management responsibilities
- Created the Start, Coach, and Support model
- Connected portfolio performance with property-level action planning
- Defined prioritisation, filtering, recognition, and status progression
- Aligned the wider journey before finalising individual components
Evidence today
The experience gives managers visibility over four properties and their twelve associated action plans per page. It dynamically moves properties through Start, Coach, and Support based on action-plan state.
The revised 4.1 proposal was estimated at approximately 3,254 hours before two omitted filters were added, compared with the 3,387-hour cost-managed version 4 estimate. This is delivery-planning evidence, not a user outcome.
Success Metrics
- Time to identify the property requiring attention
- Percentage selecting the correct coaching path
- Action-plan launch rate
- Start-to-Coach conversion rate
- Stalled-plan recovery rate
- Overdue-solution rate
- Recognition actions sent
- Repeat usage by multi-property managers
I turned a reporting-heavy dashboard into three actionable management paths, designed to help infrequent users identify priorities and move properties from stalled work toward active coaching.
PublishAI
Designing AI Around Confidence, Not Just Speed
My perspective
AI makes the moment of creation feel effortless. The more consequential design work starts immediately afterwards.
I wanted authors to understand what happened, remain in control, recover safely, and know when the result was genuinely ready.
What I led
- Structured the journey from source to published learning
- Separated acquisition, generation, editing, and readiness
- Defined visible progress and recovery
- Preserved intentional human review
- Introduced accessibility, translation, and assessment checks
Evidence today
The design direction explicitly separates AI generation, human editorial control, and publication readiness. It recommends validating the funnel before applying final visual styling.
Current adoption evidence includes at least six courses at one customer recording more than 1,000 completions each, although the team noted that the consistency of those figures should be checked.
Success Metrics
- Time from source upload to first editable draft
- Generation completion rate
- Generation abandonment rate
- Percentage of AI changes reviewed before application
- Undo and recovery success rate
- Publication-readiness pass rate
- Average manual edits before publication
- Author confidence after publishing
- Learner completion and feedback scores
I reframed AI authoring around confidence and editorial control, with generation speed, recovery, review completeness, and publication readiness as the core measures.
UX Agents
Scaling Design Capacity Without Outsourcing Judgement
I created a bounded agent model designed to improve research, copy, and estimation. The business case anticipates 16–25 hours of weekly assisted capacity, with realised time savings and output quality still requiring validation.
The Screenless Design System
Extending Design Governance Beyond the Interface
I extended the design-system model from interface consistency to behavioural accountability, defining explanation, approval, recovery, traceability, and human control as measurable experience qualities.
TrueView Product Strategy
Making Inspection-to-Resolution the Product Advantage
I shifted the strategic focus from inspection features to resolution confidence, creating a measurement model around clarity, closure speed, exception recovery, and repeat-risk reduction.
TrueView Premium Concept
Turning Analytics Into a Credible Commercial Story
I translated a broad commercial request into three connected decision views, while making feasibility explicit so the concept could inspire without overpromising.
LobsterInk UX Study
Moving From Assigned Learning to Applied Skill
I moved the design conversation from content access to learner momentum, defining the measures needed to connect assignment, completion, practical application, and manager action.
CAP Evidence and TrueView Media Library
Turning an Uploader Into an Evidence Lifecycle
I expanded a component request into a complete evidence lifecycle, with successful upload, retrieval, reuse, traceability, and reporting defined as the real measures of success.
Cross-Product Tone of Voice
Giving Different Products One Clearer Voice
I established a shared content direction across three products, turning language consistency, comprehension, recovery, and terminology reuse into measurable design-system concerns.


I help EcoSure | Ecolab create a unified digital experience across products, scale design through AI and governance, and turn operational data into action for customers.
XO Design System
Creating One Experience Across a Product Portfolio
My perspective
I did not want to build another library that looked complete in Figma but had little influence on the products themselves.
The opportunity was to create a shared language that reduced repeated decisions while giving each product room to solve its own needs.
What I led
- Defined shared foundations, components, content, accessibility, and iconography
- Connected design standards with documentation and governance
- Established a model for product-specific extensions
- Positioned adoption as a shared design and engineering responsibility
Evidence today
XO provides a common foundation across five product lines: TrueView, HDI, Lobster Ink, QPower, and CAP. Its stated purpose is to reduce decision friction and improve quality and consistency.
Success Metrics
- Percentage of eligible screens using XO components
- Number of products adopting shared foundations
- Component reuse rate
- Duplicate component reduction
- Average design-to-development lead time
- Accessibility issue rate
- Number and age of unresolved system requests
I established a shared experience foundation across five product lines, with adoption, reuse, delivery speed, and accessibility defined as the measures of long-term success.
QPower Coaching experience
Turning Portfolio Data Into Clear Management Action
My perspective
These managers may return after weeks away. I could not assume that they would remember the interface, its terminology, or the correct next step.
I designed the experience to restore context before asking users to act.
What I led
- Reframed the dashboard around management responsibilities
- Created the Start, Coach, and Support model
- Connected portfolio performance with property-level action planning
- Defined prioritisation, filtering, recognition, and status progression
- Aligned the wider journey before finalising individual components
Evidence today
The experience gives managers visibility over four properties and their twelve associated action plans per page. It dynamically moves properties through Start, Coach, and Support based on action-plan state.
The revised 4.1 proposal was estimated at approximately 3,254 hours before two omitted filters were added, compared with the 3,387-hour cost-managed version 4 estimate. This is delivery-planning evidence, not a user outcome.
Success Metrics
- Time to identify the property requiring attention
- Percentage selecting the correct coaching path
- Action-plan launch rate
- Start-to-Coach conversion rate
- Stalled-plan recovery rate
- Overdue-solution rate
- Recognition actions sent
- Repeat usage by multi-property managers
I turned a reporting-heavy dashboard into three actionable management paths, designed to help infrequent users identify priorities and move properties from stalled work toward active coaching.
PublishAI
Designing AI Around Confidence, Not Just Speed
My perspective
AI makes the moment of creation feel effortless. The more consequential design work starts immediately afterwards.
I wanted authors to understand what happened, remain in control, recover safely, and know when the result was genuinely ready.
What I led
- Structured the journey from source to published learning
- Separated acquisition, generation, editing, and readiness
- Defined visible progress and recovery
- Preserved intentional human review
- Introduced accessibility, translation, and assessment checks
Evidence today
The design direction explicitly separates AI generation, human editorial control, and publication readiness. It recommends validating the funnel before applying final visual styling.
Current adoption evidence includes at least six courses at one customer recording more than 1,000 completions each, although the team noted that the consistency of those figures should be checked.
Success Metrics
- Time from source upload to first editable draft
- Generation completion rate
- Generation abandonment rate
- Percentage of AI changes reviewed before application
- Undo and recovery success rate
- Publication-readiness pass rate
- Average manual edits before publication
- Author confidence after publishing
- Learner completion and feedback scores
I reframed AI authoring around confidence and editorial control, with generation speed, recovery, review completeness, and publication readiness as the core measures.
UX Agents
Scaling Design Capacity Without Outsourcing Judgement
I created a bounded agent model designed to improve research, copy, and estimation. The business case anticipates 16–25 hours of weekly assisted capacity, with realised time savings and output quality still requiring validation.
The Screenless Design System
Extending Design Governance Beyond the Interface
I extended the design-system model from interface consistency to behavioural accountability, defining explanation, approval, recovery, traceability, and human control as measurable experience qualities.
TrueView Product Strategy
Making Inspection-to-Resolution the Product Advantage
I shifted the strategic focus from inspection features to resolution confidence, creating a measurement model around clarity, closure speed, exception recovery, and repeat-risk reduction.
TrueView Premium Concept
Turning Analytics Into a Credible Commercial Story
I translated a broad commercial request into three connected decision views, while making feasibility explicit so the concept could inspire without overpromising.
LobsterInk UX Study
Moving From Assigned Learning to Applied Skill
I moved the design conversation from content access to learner momentum, defining the measures needed to connect assignment, completion, practical application, and manager action.
CAP Evidence and TrueView Media Library
Turning an Uploader Into an Evidence Lifecycle
I expanded a component request into a complete evidence lifecycle, with successful upload, retrieval, reuse, traceability, and reporting defined as the real measures of success.
Cross-Product Tone of Voice
Giving Different Products One Clearer Voice
I established a shared content direction across three products, turning language consistency, comprehension, recovery, and terminology reuse into measurable design-system concerns.